Analysis of The Chase
Much to my wife's dismay, I am a big fan of TV quiz shows. Today, the 2000th regular episode of The Chase will air. I'm going to take a look at the stats from the first 1,999 episodes.
But! These stats are simple to calculate and constitute nothing more than trivia. I want to look a bit deeper and try to understand Chaser performance in more detail.
Right - enough chat, more charts.
Who is the best Chaser?
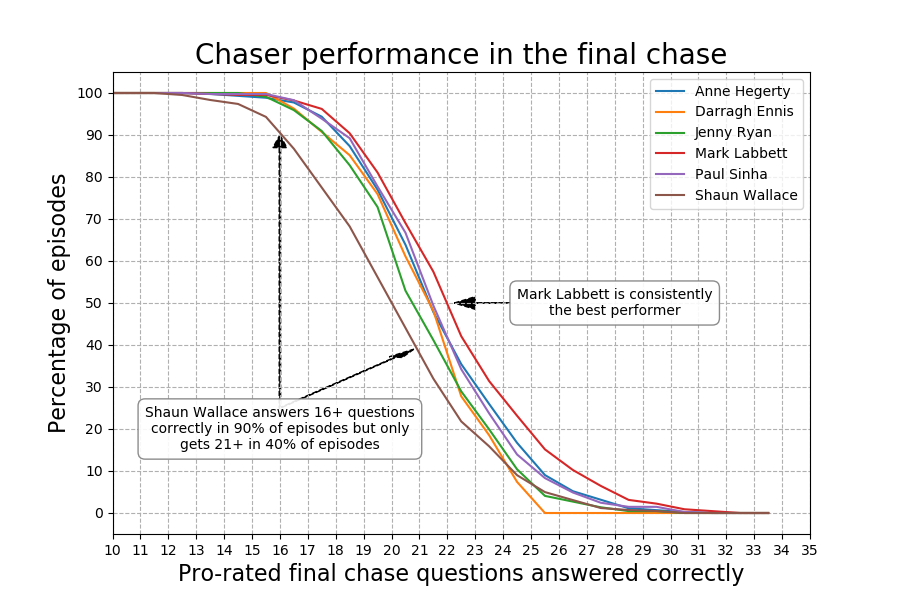
The first plot shows what scores each chaser gets in a typical episode. It can be seen that Shaun Wallace, in the average episode, answers 2 fewer questions correctly than Mark Labbett. In fact, the gap between Shaun and Mark is consistently 2-2.5 questions across almost all percentiles. The other chasers are fairly tightly clustered, about 1 question behind Mark Labbett across all percentiles.
Another way to think of this chart - if you answer 16 questions in the final chase, there is a 90% chance that Shaun Wallace would successfully meet that target, while there is a 97% chance it would be caught by any other chaser.
How has their performance changed over time?
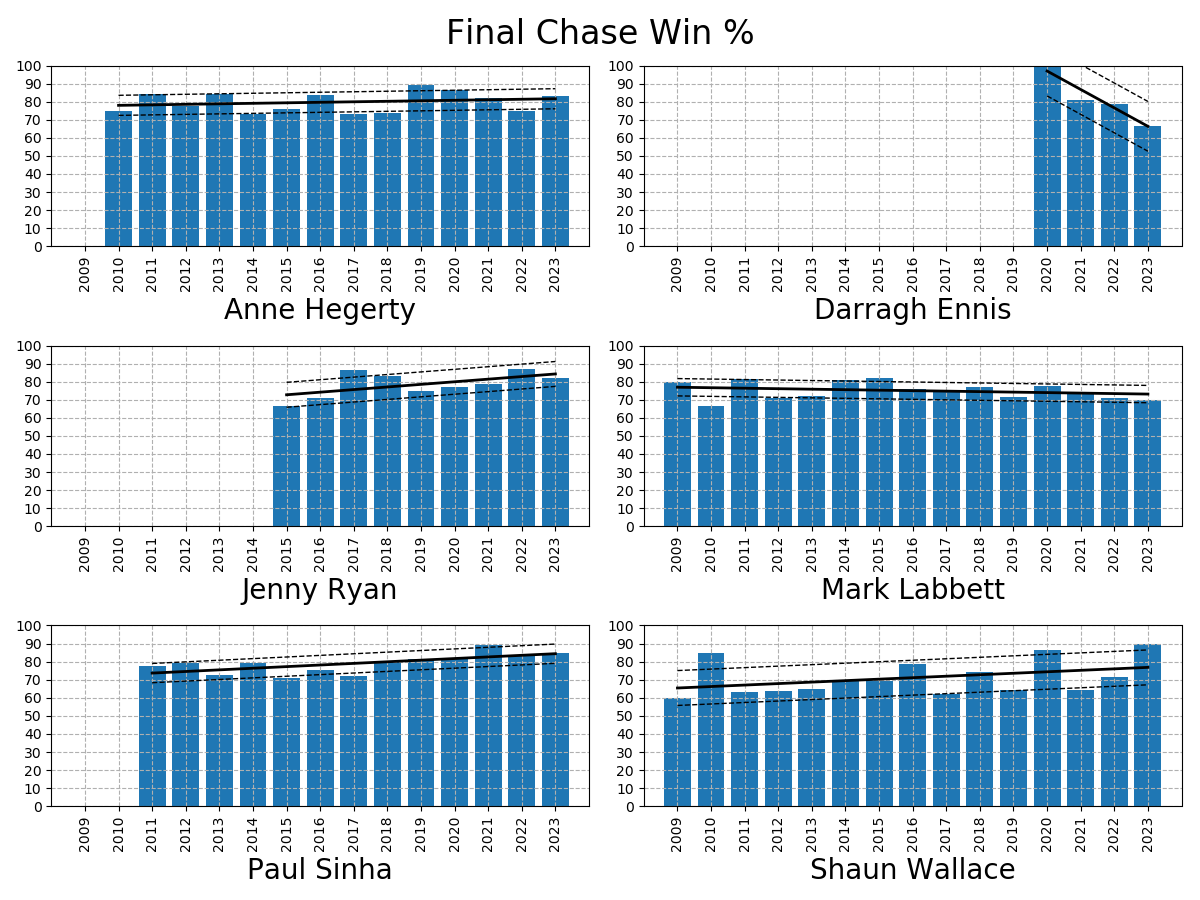
All chasers except two have shown an increase in their win percentages over time. Ironically, one of those two exceptions is Mark Labbett. However, the drop in performance is low, changing from 79% in 2009 to 75% in 2021.
The other chaser with a drop in performance is the latest addition to the lineup, Darragh Ennis. However, Darragh started arguably too well, winning every one of his 5 episodes in 2020, giving him a 100% win percentage that year. Unfortunately, there's only one direction you can go when you're at the top...
Funnily enough, the "most improved" award has to go to Shaun Wallace, increasing his average win percentage from 67% in 2009 to 78% in 2023.
Can the chasers handle the pressure?
Phrased another way - when faced with a high target in the final chase, do chasers get more questions wrong? This chart shows that the answer is: yes.
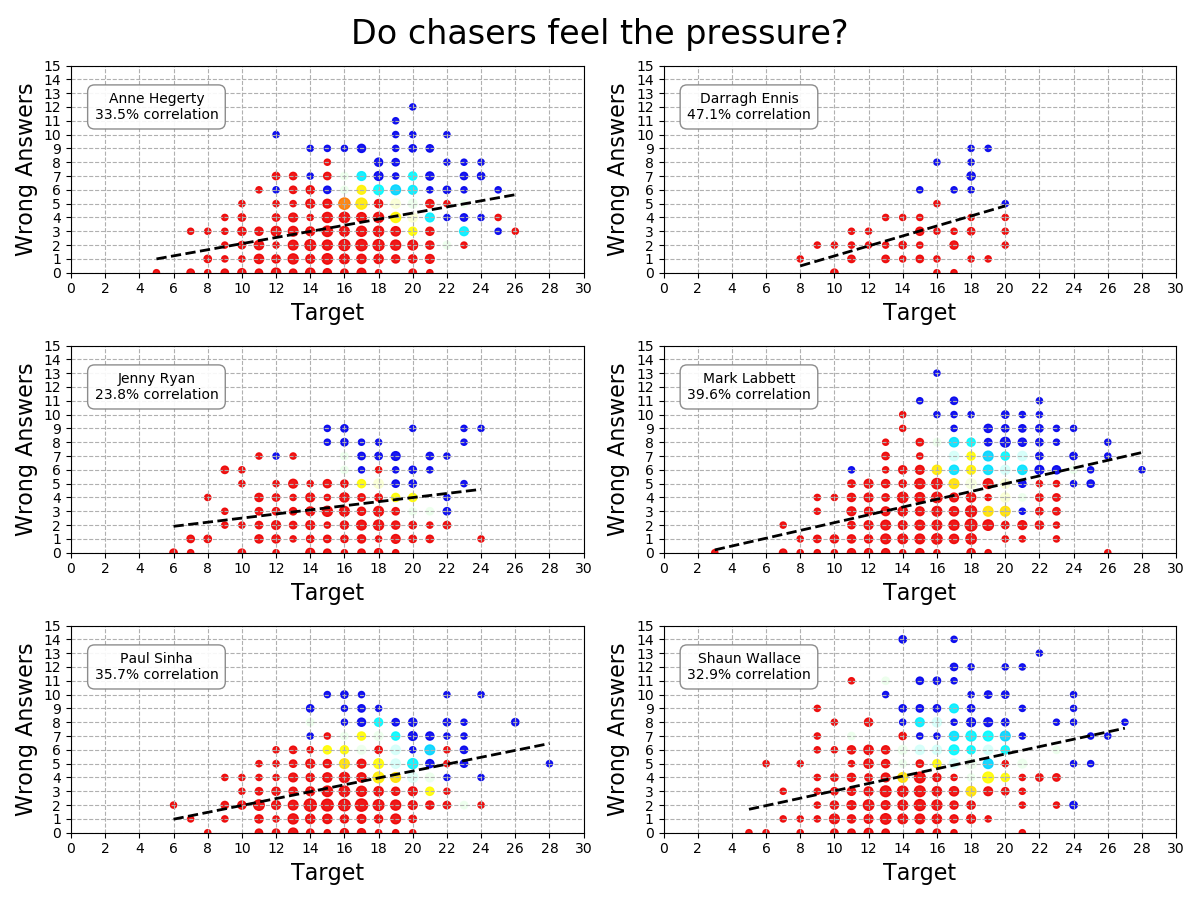
In this chart, the colours represent the chasers' win percentage. Red = 100% (i.e.e the chaser has never lost in this position), while blue circles are positions where they have never won.
All chasers show a positive correlation, but to different extents. Interestingly, Darragh Ennis and Mark Labbett show the highest correlation, indicating that they make the most mistakes when chasing a higher score.
Who is the chaser who is least affected by the pressure, the chaser with the coolest blood in their veins? That would be "The Vixen" - Jenny Ryan.
Sources
All data taken from www.onequestionshootout.xyz (link below). Many thanks to them for maintaining such a comprehensive database for nerds like me to make use of.
Thanks for reading
If you're still with me at this point, congratulations! Please do get in touch if you want to discuss any of the numbers, or if you have ideas for interesting projects for me to look into.
And here's to the next 2,000 episodes of The Chase 🍾
hashtag#datascience hashtag#python hashtag#thechase